Table of Contents

The Best Countries to Raise a Family in 2020

black lives matter protest in brooklyn new york
By &
Updated on

There’s hearsay, there are anecdotes from other families, and there are stories shared by the media. Then, there is hard data. We’ve gathered critical statistics from 30 trusted international sources to create the “Raising a Family Index” that will help you find the best countries for raising children in 2020.
The best and worst countries to raise a family in 2020 – researched by Asher & Lyric Fergusson

Please note: If you’d like to be the first to know when we update this study or when we publish new research, subscribe HERE ➜

Our methodology

We ranked 35 OECD countries (Organization for Economic Co-operation and Development) around the world to see which are the best to raise a family. Our definitive “Raising a Family Index” is made up of 6 categories, comprising a total of 30 factors identifying favorable conditions for raising a family. The categories include Safety, Happiness, Cost, Health, Education, and Time.

Click the toggles below to see all our data sources, the weighting we gave to each, and a full explanation of the methodology used in our study.

SAFETY Factors – (Click to expand)
This category helps to measure the overall safety of a country as it relates to raising a family. The factors include:

  • Homicide per 100,000 people (-1x weight) — Homicide is a problem that is very country-specific and not a quality that is conducive to raising a family. In most countries including in our list, homicide rates are very low. But for some like Mexico, homicides can be a common occurrence.

    Source: Homicides — Our World in Data (2017)

  • Global Law & Order Index (1x weight) — Gallup’s Law and Order Index uses four questions to gauge people’s sense of personal security and their personal experiences with crime and law enforcement. These four questions are:

    • In the city or area where you live, do you have confidence in the local police force?
    • Do you feel safe walking alone at night in the city or area where you live?
    • Within the last 12 months, have you had money or property stolen from you or another household member?
    • Within the past 12 months, have you been assaulted or mugged?

    Source: Global Law and Order Index — Gallup (2019)

  • Global Peace Index (-1x weight) — The Global Peace Index (GPI) ranks 163 independent states and territories according to their level of peacefulness. Produced by the Institute for Economics and Peace (IEP), the GPI is the world’s leading measure of global peacefulness. This report presents the most comprehensive data-driven analysis to date on peace, its economic value, trends, and how to develop peaceful societies.

    Source: Global Peace Index — Institute for Economics & Peace (2019)

  • Number of School Shootings Per 10 Million People (-1x weight) — There is little doubt that school shootings are a reality in America. This metric is very good indicator of the level of stress within the schools of a country and we think is very important to include in the study.

    Source: School Shootings — CNN (2018)

  • Human rights (1x weight) — Human rights describe moral norms or moral standards which are understood as inalienable fundamental rights of every human person. Human rights encompass a wide variety of rights, including but not limited to the right to a fair trial, protection of physical integrity, protection against enslavement, the right to free speech, and the right to education.

    Source: Human Rights — Our World in Data (2017)

HAPPINESS Factors – (Click to expand)

This category helps to measure the overall happiness in a country as it relates to raising a family. The factors include:

  • The Human Freedom Index (1x weight) — The Human Freedom Index (HFI) presents a broad measure of human freedom, understood as the absence of coercive constraint. This fifth annual index uses 76 distinct indicators of personal and economic freedom.

    Source: Human Freedom Index — CATA.org (2019)

  • World Happiness Report (1x weight) — The World Happiness Report is a landmark survey of the state of global happiness that ranks 156 countries by how happy their citizens perceive themselves to be. This year’s World Happiness Report focuses on happiness and the community: how happiness has evolved over the past dozen years, with a focus on the technologies, social norms, conflicts and government policies that have driven those changes.

    Source: World Happiness Report — WorldHappines.report (2019)

  • Suicide Rates per 100,000 people (-1x weight) — This factor is a good indicator of deep unhappiness within a country. In this case,suicide rates are defined as the deaths deliberately initiated and performed by a person in the full knowledge or expectation of its fatal outcome. Comparability of data between countries is affected by a number of reporting criteria, including how a person’s intention of killing themselves is ascertained, who is responsible for completing the death certificate, whether a forensic investigation is carried out, and the provisions for confidentiality of the cause of death.

    Source: Suicide rates — OECD (2018)

  • LGBTQ+ Adoption Recognition Laws (1x weight) — Is joint adoption and/or second-parent adoption legal in this country for same-sex parents? The recognition of both joint and second-parent adoption received full points while countries not allowing LGBTQ+ adoption received zero points.

    Source: Sexual Orientation Laws in the World — ILGA (2019)

  • Distribution of Family Income Equality – GINI Index (-1x weight) — GINI index measures the degree of inequality in the distribution of family income in a country. The more nearly equal a country’s income distribution, the lower its GINI index, e.g., a Scandinavian country with an index of 25. The more unequal a country’s income distribution, the higher its GINI index, e.g., a Sub-Saharan country with an index of 50. If income were distributed with perfect equality the index would be zero; if income were distributed with perfect inequality, the index would be 100.

    Source: The GINI Index — CIA.gov (2017)

COST Factors – (Click to expand)
This category helps to measure the cost to raise a family in each country. The factors include:

  • Percentage of household income toward net child care costs (-1x weight) — This indicator measures the net childcare costs for parents using full-time centre-based childcare, after any benefits designed to reduce the gross childcare fees. Net childcare costs are calculated for both couples and lone parents assuming two children aged 2 and 3. For couples, one parent earns 67% of the average wage whereas the other earns either minimum wage, 67% or 100% of the average wage.

    Source: Net Childcare Costs – OECD (2020)

  • Public spending on family benefits by percent of GDP (1x weight) — Family benefits spending refer to public spending on family benefits, including financial support that is exclusively for families and children. Spending recorded in other social policy areas, such as health and housing, also assist families, but not exclusively, and it is not included in this indicator.

    Source: Family Benefits Public Spending – OECD (2020)

  • Private spending on education from primary to tertiary by percent of GDP (-1x weight) — Private spending on education refers to expenditure funded by private sources which are households and other private entities. This indicator is shown as a percentage of GDP, divided into primary, primary to post-secondary non-tertiary and tertiary levels. Private spending on education includes all direct expenditure on educational institutions, net of public subsidies.

    Source: Private Spending on Education – OECD (2020)

  • Out-of-pocket health spending in dollars (USD) per capita (-1x weight) — Health spending measures the final consumption of health care goods and services (i.e. current health expenditure) including personal health care and collective services, but excluding spending on investments. This indicator is presented as a total of out-of-pocket financing and is measured as a share of GDP, as a share of total health spending and in USD per capita (using economy-wide PPPs).

    Source: Health Spending – OECD (2020)

  • Purchasing Power Index measuring cost of living vs. monthly income (1x weight) — This indicator measures the cost of living versus average monthly income around the world. It is based upon the average cost of living inside the USA (based on 2019) to an index of 100. All other countries are related to this index. The calculated purchasing power index is also based on a value of 100 for the United States. If the index score is higher, families will be able afford more based on the cost of living in relation to their monthly income.

    Source: Comparison of Worldwide Cost of Living – WorldData (2019)

HEALTH Factors – (Click to expand)
This category helps to measure the healthcare systems and health-related environmental factors as it relates to raising a family. The factors include:

  • Maternal Mortality Rate – Deaths per 100,000 live births (-1x weight) — The maternal mortality rate (MMR) is the annual number of female deaths per 100,000 live births from any cause related to or aggravated by pregnancy or its management (excluding accidental or incidental causes).

    Source: Maternal Mortality Rate – CIA.gov (2015)

  • Under-five Child Mortality Rate – Deaths per 1,000 live births (-1x weight) — The world has made remarkable progress in child survival in the past few decades, and millions of children have better survival chances than in the nineties. Despite the global progress in reducing child mortality over the past few decades, an estimated 5.3 million children under age five died in 2018–roughly half of those deaths occurred in sub-Saharan Africa.

    Source: Under-five Child Mortality Rate – Unicef (2019)

  • Unmet demand for family planning by % of women aged 15-49 (-1x weight) — This factor measures the percentage of currently married or in-union women of reproductive age (15–49) who want to stop or delay childbearing but are not using any method of contraception.

    Source: Global Gender Gap Report – World Economic Forum (2020)

  • Share of population exposed to air pollution above WHO limits (-0.5x weight) — In order to limit the adverse health impacts of air pollution, the World Health Organization (WHO) lays out clear recommendations for exposure to air pollution – these are its so-called Air Quality Guidelines (AQG). The WHO defines these AQG for various air pollutants based on an epidemiological assessment of the link between pollution exposure and health consequences.

    Source: Outdoor Air Pollution — Our World in Data (2016)

  • World’s most polluted countries (PM2.5) (-0.5x weight) — This index measures the most polluted countries based on 2.5 micrometer particulate matter (PM2.5) levels according to data aggregated from over 60,000 data points.

    Source: World’s Most Polluted Countries – IQAir (2019)

  • Life Expectancy at Birth (1x weight) — Life expectancy is the key metric for assessing population health. Broader than the narrow metric of the infant and child mortality, which focus solely at mortality at a young age, life expectancy captures the mortality along the entire life course. It tells us the average age of death in a population.

    Source: Life Expectancy – Our World in Data (2019)

EDUCATION Factors – (Click to expand)
This category helps to measure the quality of education in a country. The factors include:

  • Enrollment Rate Among 15 – 19 year-olds (1x weight) — Enrollment rate per age is the percentage of students enrolled in each type of institution over the total of students. This factor is a good indicator of the percentage of students who attend and graduate high school per country.

    Source: Enrollment rate by age — OECD (2017)

  • Enrollment Rate Among 20 – 24 year-olds (1x weight) — Enrollment rate per age is the percentage of students enrolled in each type of institution over the total of students. This factor is a good indicator of the percentage of students who attend and graduate tertiary school per country.

    Source: Enrollment rate by age — OECD (2017)

  • Reading performance – PISA (1x weight) — Reading performance, for PISA, measures the capacity to understand, use and reflect on written texts in order to achieve goals, develop knowledge and potential, and participate in society. The mean score is the measure.

    Source: Reading performance — OECD (2018)

  • Mathematics performance – PISA (1x weight) — Mathematical performance, for PISA, measures the mathematical literacy of a 15 year-old to formulate, employ and interpret mathematics in a variety of contexts to describe, predict and explain phenomena, recognizing the role that mathematics plays in the world. The mean score is the measure. A mathematically literate student recognizes the role that mathematics plays in the world in order to make well-founded judgments and decisions needed by constructive, engaged and reflective citizens.

    Source: Mathematics performance — OECD (2018)

  • Science performance – PISA (1x weight) — Scientific performance, for PISA, measures the scientific literacy of a 15 year-old in the use of scientific knowledge to identify questions, acquire new knowledge, explain scientific phenomena, and draw evidence-based conclusions about science-related issues.

    Source: Science performance — OECD (2018)

TIME Factors – (Click to expand)
This category helps to measure the time parents have to spend with their children. The factors include:

  • Yearly hours worked per worker (-1x weight) — Average annual hours worked is defined as the total number of hours actually worked per year divided by the average number of people in employment per year. Actual hours worked include regular work hours of full-time, part-time and part-year workers, paid and unpaid overtime, hours worked in additional jobs, and exclude time not worked because of public holidays, annual paid leave, own illness, injury and temporary disability, maternity leave, parental leave, schooling or training, slack work for technical or economic reasons, strike or labour dispute, bad weather, compensation leave and other reasons.

    Source: Hours Worked – OECD (2020)

  • Paid maternity leave in weeks (1x weight) — Maternity leave is defined as employment-protected leave of absence for employed women directly around the time of childbirth. In most countries, beneficiaries may combine pre- with post-birth leave; in some countries, a short period of pre-birth leave is compulsory, as is a period following birth. Almost all OECD countries have public income support payments tied to maternity leave. The United States is the only country in our study that offers zero paid maternity leave.

    Source: Parental Leave Systems – OECD (2018)

  • Please note: The United States is the only country on our list which does not mandate paid leave. According to a study by World at Work, only 38% of US organizations offer paid parental leave to all or some new-parent employees. Of the parents that receive paid parental leave, the average length at full pay, is 4.1 weeks (median: 3.0 weeks). US employers may also offer paid sick leave and vacation days at their discretion.
  • Paid paternity leave in weeks (1x weight) — Paternity leave is defined as employment-protected leave of absence for employed fathers at or in the first few months after childbirth. Paternity leave is not stipulated by international convention. In general, periods of paternity leave are much shorter than periods of maternity leave. Because of their short length, workers on paternity leave often continue to receive full wage payments. Example countries that offer zero paid paternity leave include: United States, Canada, New Zealand, Norway and Germany.

    Source: Parental Leave Systems – OECD (2018)

  • A Comparison of Paid Sick Day Policies (1x weight) — If there is no policy for taking paid time off for illnesses, many workers continue to go to work when they are sick, jeopardizing their coworkers health and their own recovery. Research has shown that taking adequate time to rest and recuperate when sick encourages a faster recovery and helps prevent the spread of illness along with minor health conditions from progressing into more serious illnesses. All numbers used were based on full pay for a 5-day flu.

    Source: A Comparison of Paid Sick Day Policies – CEPR (2009)

  • Minimum paid annual leave (1x weight) — In the majority of nations, including all industrialized nations except the United States, advances in employee relations have seen the introduction of statutory agreements for minimum employee leave from work that is the amount of entitlement to paid vacation and public holidays.

    Source: Minimum annual leave by country – Wikipedia (2020)

The 35 best countries to raise a family

helsinki finland
Downtown Helsinki, Finland.
Not surprisingly, all the Scandinavian countries ranked very well for raising a family. Out of the 35 countries included in our analysis, Iceland narrowly beat Norway to claim the #1 spot on the list. Iceland achieved top-10 rankings in all categories and was #1 in safety.

Below are the 35 best:

  1. Iceland
  2. Norway
  3. Sweden
  4. Finland
  5. Luxembourg
  6. Denmark
  7. Germany
  8. Austria
  9. Belgium
  10. Czech Republic
  11. Netherlands
  12. Portugal
  13. France
  14. Australia
  15. Slovenia
  16. Ireland
  17. Spain
  18. New Zealand
  19. Canada
  20. Poland
  21. Hungary
  22. Switzerland
  23. United Kingdom
  24. Italy
  25. Japan
  26. Israel
  27. Slovak Republic
  28. Korea
  29. Greece
  30. Romania
  31. Bulgaria
  32. Turkey
  33. Chile
  34. United States
  35. Mexico

Use our interactive tool to find  the ideal country for raising your family

Instructions: Simply click on the column titles to sort by that filter. For example, click on the “Safety” title and the list will show the least safe countries for raising a family down to the most safe. Click the same title again and it will show the most safe to the least safe etc. The scores you see are the index scores we used to create our overall “Raising a Family Index”. In all cases, the higher the number, the better the country scored.

Please note: If you’re on a mobile device you can scroll horizontally to see all the data.

RANKCOUNTRYSAFETYHAPPINESSCOSTHEALTHEDUCATIONTIMEINDEX
1Iceland150.9193.5104.70.2438.9204.81093.1
2Norway98.9188.8109.4-1.4450.6244.31090.5
3Sweden103.1191.4117.8-17.0456.2200.11051.7
4Finland114.5178.757.211.8468.2212.61043.1
5Luxembourg130.6195.6116.6-69.3385.6263.51022.7
6Denmark119.8196.299.9-102.2466.0170.4949.9
7Germany97.0191.257.6-98.2457.3209.7914.6
8Austria109.4174.547.2-92.0419.2238.4896.6
9Belgium96.8162.847.0-86.6468.0154.3842.3
10Czech Republic111.878.755.4-67.6446.1170.3794.6
11Netherlands115.9186.0-9.2-93.0473.798.8772.2
12Portugal78.9161.0-32.5-75.0435.7192.8760.8
13France64.4163.760.6-79.5434.5100.1743.8
14Australia89.2174.5-61.2-45.5472.3114.4727.4
15Slovenia118.795.03.7-87.5484.4102.6717.0
16Ireland107.6183.929.9-79.8458.316.7716.5
17Spain77.8171.7-2.8-75.6451.185.7707.9
18New Zealand121.0171.5-66.4-79.0444.097.8683.6
19Canada93.3179.7-53.8-52.8431.739.4637.5
20Poland80.357.9-27.2-121.0457.7179.2627.0
21Hungary38.838.849.8-143.8422.2205.8611.6
22Switzerland106.588.5-46.0-87.7438.296.6596.1
23United Kingdom88.1190.3-64.4-91.7429.025.8581.8
24Italy71.083.633.8-97.7422.261.2574.0
25Japan103.529.2-52.4-121.4470.7138.2567.8
26Israel-1.4168.912.9-107.6368.675.1516.5
27Slovak Republic79.473.2-1.4-136.4408.274.6497.5
28Korea65.5-2.5-62.6-109.1471.4118.2483.5
29Greece29.760.5-6.2-122.5435.684.6481.7
30Romania62.465.4-71.3-240.3397.4162.7376.3
31Bulgaria53.122.6-118.2-219.3397.4165.9301.6
32Turkey-35.948.2-6.5-236.3424.861.6255.9
33Chile48.728.2-60.3-235.4407.634.2223.0
34United States-80.8131.8-124.4-130.9429.8-93.1132.4
35Mexico-135.940.4-120.5-365.6345.7-43.8-279.6

Why did the US rank so poorly?

Since the United States was in many ways an outlier, we felt it was necessary to give additional commentary, context and statistics on why the US ranked second to last on our list.

Additionally, Lyric shares her perspective on raising our family of two young kids, Kingsley and Aurora, in the USA. She goes through all six categories and reflects on her experience of being a mother but also her experience growing up in America.

Here are her thoughts:

The first time I looked at the data I was in disbelief. I thought there must be a mistake.

I know Americans are struggling, but how could the United States rank as the 34th best country to raise a family in 2020?

I said, “We have to check. We need to crunch the numbers again.” We did. The data was undeniably correct.

This led me into a deep personal reflection. Would my anecdotal experience, growing up and raising two children in the US, remotely line up with the data?

I went one-by-one into each of the six categories. What I discovered, in many instances, was quite shocking. I had experienced trauma or notable challenges in each category.

In “Safety” alone, I experienced two violent incidents before I turned 20: one school shooting and one student homicide in my college cafeteria.

This study has been eye-opening for me. Even as a well educated, thoughtful individual, I had become so numb to the country’s inadequacies that I must have simply disregarded my personal experience for the rhetoric of the nation.

Below you’ll find an elaboration on the most pertinent US raw data, additional important related statistics, plus my anecdotal experience growing up and raising a family here in the USA. Be sure to check out the “Click to expand” sections to see the my full write-up for each category.

SAFETY in the United States

active shooter drill
School employees play dead on the floor during an active shooter drill with a masked gunman in Rittman, OH.
Key findings:

  • The US ranked second-worst in the safety category scoring an F.
  • There are 6.12 homicides per 100,000 people in America (bested only by Mexico).
  • From 2009-2018, the US has had 288 school shootings (8.70 school shootings per 10 million people). Mexico comes in second at 8 (0.62 school shootings per 10 million people). Almost every single other country on the list has zero.
  • “Active Shooter Drills” – involving actors dressed up as masked gunmen, teachers being shot with airsoft rifles while the children have not been informed it’s a drill – are now commonplace in 95% of public schools across America.
  • The US also ranks poorly in the human rights category coming in at fourth-worst.

Click the below toggle to expand more info about safety in the US as well as my firsthand experience with both a school shooting and a homicide at my college cafeteria.

Learn more about SAFETY in the US – (CLICK to expand)

Homicides

America ranks second-worst in our raising a family “Safety” category. The US has 6.12 reported homicides per 100,000 (bested only by Mexico), whereas most countries on our list are around 1 or less.

Human Rights

The US also scores poorly in the human rights category. Our systemic racism is just one example, which has been recently exposed during the Black Lives Matter Protests. It has become strikingly clear that people of color do not feel safe in America.

To give some perspective, it won’t be until fall 2020 that events such as the Tulsa Massacre and bombing of Black Wall Street (which took place on June 1, 1921) will even be entered in school history books.

And it wasn’t until 1996 that the US government even investigated this particular event and the murders of approximately 300 individuals. The conclusion of the investigation, published in 2001, said that “the city (of Tulsa Oklahoma) had conspired with the mob of white citizens against black citizens.”

These governmentally incited genocidal events are more commonplace in America’s history than previously realized, and the horrific treatment of people of color is at the heart of one of many human rights battles taking place today.

School Shootings

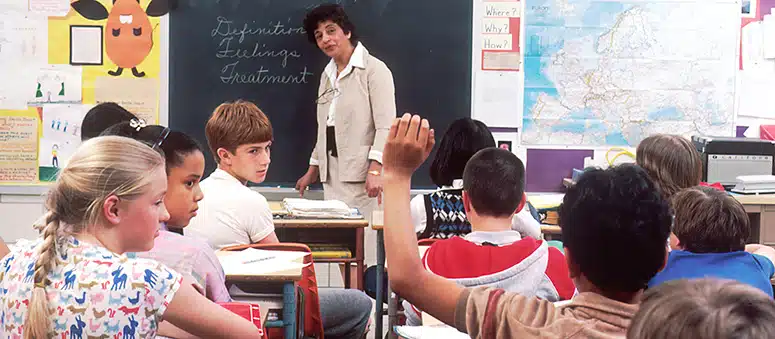
America also has an extraordinary amount of peer to peer violence. This is undeniably reflected in school shootings. From 2009-2018, the US has had 288 school shootings. 288. Mexico comes in second at 8, whereas almost every single other country on the list has zero.

ABC News explains such incidents of gun violence at schools in the US are actually more commonplace than reported as there is no nationally accepted definition of what constitutes a “school shooting.”

For example, “Everytown, an independent, non-profit group that studies gun violence, reports it has tracked at least 99 incidents of gunfire on school grounds in 2019 alone (through Dec. 11), including three suicides and 63 injuries.”

Whether or not parents believe in their 2nd Amendment Right to Bear Arms, mothers and fathers are having the discussion of safety across the board.

It is a frightening, yet accepted, undercurrent for raising a family in 2020. Unpredictable as these incidents are, most parents have no other option than to hope their child’s public school is one of the lucky ones, spared from this sort of violence.

Active Shooter Drills

Although Active Shooter Drills didn’t factor into the school shooting data we felt it was important to mention, as they are a painful reality for American families.

According to Reuters, “(Active Shooter Drills) unfold unannounced and involve actors dressed as masked gunmen, teachers being lined up and shot with an airsoft rifle and students as young as 3 years old told to hide in a small space for long periods of time, the report said.”

Even if parents feel it is unlikely that their child’s school will be affected by a school shooting, active shooter drills are now commonplace in 95% of public schools across America. Watch this video from March for Our Lives to see what it’s really like to prepare for a school shooting.

I can’t help but wonder what kind of country we are living in when 95% of our children in public schools are being exposed to this type of stress and anxiety as commonplace.

The trauma students experience during these types of drills has been proven to have detrimental long-term effects.

What are parents’ options?

Parents who can afford it often turn to private education. Private Schools in the US have somehow, thus far, avoided the level of violence prevalent in the nations’ public education system.

But, private schools in big cities come with huge price tags. They average around $40,000 a year (per child) for high school and kindergarten starts at somewhere around $25,000.

This means American parents with two high school age students need to have $80,000 plus to allocate towards education.

Asher and I struggle to dedicate 12% of our yearly income to send our son Kingsley to a private pre-school. (We live in a smaller city so the cost is $12,500/year for pre-K.) When our daughter attends school, that will mean we’ll have to come up with at least $25,000 per annum.

My Personal Experience of Violence in America

I spent my high school years in a very sheltered place called Toluca Lake, a wealthy suburb of Los Angeles, California.

Growing up, I was lucky that money was not something that was at the forefront of my childhood struggles. Yet, even in my “bubble of a neighborhood”, police helicopters circled nightly; often illuminating my backyard in search of fugitives.

It was considered an inconvenience when the 405 or 101 highways would close for police chases. Violent crimes —rape, kidnappings, murders— plastered the nightly news, which was often our after-dinner soundtrack.

It was just something people in LA are used to. The violence is like a constant aching fever that won’t go away, but somehow everyone considers it “normal”.

That said, as a young woman I was fearful to walk alone, especially at night. My parents refused to send me to public school because of the constant violence in the LA Unified School Districts. Friends of ours working as teachers in these public schools described the environments as fearful, hostile, and intense; as they and their students were forced to walk through metal detectors before entering their classrooms.

My high school, Westridge School for Girls, now costs $37,750 plus $1000 in fees per year.

My Experience of Gun Violence at A School Related Event

ABC News found that 57.6% of school shootings were at sporting events.

In my sophomore year in high school where I attended a public school football game in Monrovia (near Pasadena.) After the game we were heading back to the car when a fight broke out.

I heard someone shout, “He’s got a gun!” before several shots were fired.

My friends and I hid in a bush as we watched a young man run by with a handgun. No one was killed in that incident but it was a brief glimpse of the reality so many of my peers faced (and face) every single day. No one felt safe.

My Experience at NYU

As a freshman student at New York University, I experienced the 9/11 twin tower attack. As a sophomore, I carried pepper spray walking home at night. My apartment was in “Alphabet City” (which has since been “gentrified”) with a fire escape ladder outside my bedroom window. There was never a night that I wasn’t concerned someone would break-in and try to attack me.

My Experience at Maharishi International University

I left NYU during my junior year in search of a more peaceful and introspective approach to education. I found myself at a school called Maharishi International University. The school incorporates meditation into its daily classes. It was a good change for me.

And it was there, of all places, that I witnessed the murder of my friend Levi, in the college cafeteria.

Levi was stabbed in the neck by another student in an unprovoked incident. I called the paramedics and was with him as blood engulfed his windpipe. He gasped for air until they took him away, and died on the way to the hospital.

The young man who killed my friend did not have a gun — only a steak knife. If he had a gun there is no doubt in my mind I would have been shot myself, if not killed.

Conclusion

When I read the above account of the first 19 years of my life it’s shocking. I was sheltered, I grew up in a bubble, and yet I was not immune to any of these violent incidents.

Two months ago, Asher and I had to call the cops here in Santa Fe, NM, because someone was breaking into our neighbor’s home. The police came and shot the robber with rubber bullets as he made a run for it. A few weeks earlier, my dear friend’s home was broken into and had all her most precious belongings stolen. Both mentioned neighborhoods are considered “safe.”

Why am I writing down all these incidents? I think to help myself understand how the US could have ranked so poorly. Honestly, I didn’t believe it until I started deeply reflecting.

Was I always in the wrong place at the wrong time? Maybe. Or is America actually a tsunami of violent incidents that we are all just so numb to that we no longer register them?

I have a feeling it’s the latter.


HAPPINESS in the United States

fergusson family on vacation in california
Our family savoring our vacation.
Key findings:

  • America gets a C+ in our Happiness Index.
  • Income disparities are so pronounced that America’s top 10% now earn on average more than 9 times as much as the bottom 90%.
  • 1 in 5 Americans experience a mental health disorder, such as depression or anxiety, each year.
  • The suicide rate amongst Americans has increased by 33% between 1999 to 2017, whereas it has decreased in many other comparable countries.

Click the below toggle to expand more info about happiness in the US as well as my firsthand experience.

Learn more about HAPPINESS in the US – (CLICK to expand)
America gets a C+ in our Happiness Index.

One of the most pronounced statistics in this category is the US’s poor score of 45 for inequality in family income. This ranking is on par with many non OCED countries such as Cameroon, Mozambique and Saudia Arabia.

Why? According to data analyzed by UC Berkeley economist Emmanuel Saez, America’s top 10% is now averaging 9 times as much income as the bottom 90%. Americans in the top 1% average over 39 times more income than the bottom 90 percent, and the nation’s top 0.1% earns 196 times the income of the bottom 90 percent.

This article by Inequality.org goes into detail regarding the state of income inequality in America, and how it has worsened somewhat dramatically since the crash of 2008.

According to the National Alliance on Mental Illness 1 in 5 Americans experience a mental health disorder, such as depression or anxiety, each year.

A study published by the Mayo Clinic states that nearly 70 percent of Americans are on at least one prescription drug, and more than half take two.

The study author, Dr. Jennifer St. Sauver, explains “The second most common prescription in our community is for antidepressants, so that does suggest that mental health conditions are a huge issue in our community and maybe an area we should focus on.”

In addition, the suicide rate amongst Americans increased by 33% between 1999 to 2017.

“But it’s a different story in other parts of the world.” The American Psychological Association explains, “Over roughly the same period, other countries have seen (suicide) rates fall, including Japan, China, Russia and most of Western Europe.”

Americans are struggling. We are struggling with making enough money to provide for our families, we are struggling with racial inequality, we are struggling to feel safe and provide our people with adequate health care. We get no government-mandated paid leave, for sickness (including life-threatening illnesses), or maternity or paternity leave – let alone vacation time.

How can a country that is toiling with so many inadequacies have a population of happy people?

My experience with Happiness in America

Growing up in Los Angeles, surrounded by extremely successful people, I don’t think I knew anyone that I would subjectively consider truly “happy.”

Even now, I myself struggle to feel happy here in America. There are so many foundational challenges that the country faces as a whole; and all of these things greatly affect my quality of life.

As a result, Asher and I are constantly discussing where in the US is the best place to raise our family. After conducting this study we realized that we need to look to other nations to find the level of quality of life that we wish to experience.


COST in the United States

us dollars
One hundred dollar bills.
Key findings:

  • The US gets an F in our cost section, ranking last.
  • Families in the United States spend approximately 23% of their combined average annual income on childcare alone.
  • You are twice as likely to die in childbirth in America versus Canada, even though US families pay over three times as much to deliver a baby.

Click the below toggle to expand more info about cost in the US as well as my firsthand experience.

Learn more about COST in the US – (CLICK to expand)

The cost of raising a family in America is brutal.

Net Childcare Cost

Most countries that ranked highly in this category, such as Norway and Sweden, support parents with government-subsidized childcare costs. Parents in these countries spend only 5-8% of their average yearly income on childcare.

In contrast, in the United States, we are expected to dish out 23% of our combined average yearly income — just so our children are cared for while we go to work.

Health Care Costs

The United States also tops the list in health care costs. American health care is double the cost of any comparable country. Interestingly, the cost of care and the quality of care do not line up.

We have seen with the recent COVID-19 outbreak that America does not perform better. In fact, America is performing noticeably worse than in most countries. Democratic House Speaker Nancy Pelosi confirmed this by stating, “We are 4 percent of the world’s population. We are 25 percent of the cases and the deaths, 25 percent. We have the worst record of any country in the world.”

Giving birth in America

America is also the most expensive western country in the world in which to give birth.

According to a report on Business Insider, “The average cost to have a baby in the US, without complications during delivery, is $10,808 — which can increase to $30,000 when factoring in care provided before and after pregnancy.” This is if you have insurance.

Just across the border in Canada, it costs a third of the US at only $3,195 for a vaginal birth.

Shockingly, you are twice as likely to die in childbirth in the US as opposed to Canada – even though Canada is one-third of the cost.

By charging an average of $10,000 just to give birth we are strangulating families in America; putting them immediately into deep financial strain upon beginning a family.

Our Experience with Out of Pocket Child Care Expenses

After having my second child, my health severely declined. Even though I was a stay at home mom, I needed a lot of help to just get through the day.

Asher and I spent close to $2,500 a month on childcare for a period of time. We had to do it out of necessity but it forced us to lean heavily on credit cards to survive each month. And now we remain heavily in debt as a result.

Our Experience with Health Care Costs

Insurance and health care costs have also been painfully expensive. Because we make just over $100k a year we were quoted close to $2,000 a month for a simple bronze plan while living in Iowa with a $8k deductible per person for the four of us. That is $24,000 a year just for insurance, not including co-pays or any emergencies.

We decided to go with a cheaper short term health plan and found that it covers hardly anything. I ended up needing to go to the emergency room for some tests and even though I only stayed for three hours I got slapped with a bill of $2,500 after insurance adjustments. This particular insurance also doesn’t cover child wellness visits or any vaccinations. I don’t think I ever feel quite as helpless as I do when trying to take care of my and my family’s health in America.

Our Experience with Birth in America

Asher and I decided to have home births with our two children. We chose to pay a combined $5,000 (per child) out of pocket for a midwife. This is half of the cost of an average birth (with insurance) in the US.

Our Experience with Education Costs

Asher and I have chosen to send our son to a private pre-school, as we didn’t feel comfortable with the quality of education in the local public school system. Once our daughter is school age it will cost us approximately $25,000 per year for pre-K education.


HEALTH in the United States

asher and lyric fergusson at birth of daughter
My hubby and I with our daughter, Aurora, moments after she was born at our home.
Key findings:

  • America ranks as the 8th worst country for “Health.”
  • Americans, constituting only 4.6% of the world’s population, have been consuming 80% of the global opioid supply, and 99% of the global hydrocodone supply, as well as two-thirds of the world’s illegal drugs.
  • 1 in 16 American children (age 12-19) are taking prescription stimulants to treat attention deficit disorder.
  • 6 in 10 (approx. 197 million) Americans suffer from 1 incurable chronic disease. 4 in 10 suffer from 2 or more.
  • 44.52% of the population is exposed to air pollution over WHO limits.

Click the below toggle to expand more info about health in the US as well as my firsthand experience.

Learn more about HEALTH in the US – (CLICK to expand)
America ranks 8th worst.

Although America didn’t make the top 5 worst for “Health,” it came close — ranking 8th worst.

The US maternal mortality rate is 14 per 100,000 live births, the child mortality rate is 6.5 per 1,000 children, the unmet demand for family planning is 9%, 44.52% of the population is exposed to air pollution over WHO limits, and the average life expectancy is only 78.

Are Americans Unhealthy?

The CDC reports that 6 in 10 (approximately 197 million) Americans currently suffer from one chronic disease, and 4 in 10 suffer from 2 or more.

Another Mayo Clinic study found that approximately 70% of Americans are prescribed a minimum of one medication — half were given two or more — with antibiotics, antidepressants, and opioids at the top.

Bloomberg explains, “Americans are good at popping pills… between (ages) 12 to 19 years old, stimulants to treat attention deficit disorder were most common with about 1 in 16 adolescents with a prescription.”

Yes. 1 in 16 American children are on a behavioral prescription drug – not including antidepressants.

According to study shared by the National Center for Biotechnology Information, Americans, constituting only 4.6% of the world’s population, have been consuming 80% of the global opioid supply, and 99% of the global hydrocodone supply, as well as two-thirds of the world’s illegal drugs. For some perspective, Canada and Western Europe consume a combined total of 15% of the world’s opioids.

CNBC explains, “In most countries, the use of opioid prescriptions is limited to acute hospitalization and trauma, such as burns, surgery, childbirth and end-of-life care, including patients with cancer and terminal illnesses. But in the United States, every adult in America can have ‘a bottle of pills and then some,’ (former) U.S. Surgeon General Vivek Murthy has said publicly.”

Conclusion? Americans are either extremely ill or heavily over-medicated (or both). This article by Heathline goes into detail on how the massive quantity of medications prescribed are actually to the detriment of the people.

Coronavirus has also shone a morbidly bright light on the inadequacies of the health, and health care systems, available in the United States. Interestingly, even though we have one of the lower life expectancies in our study, we can see in the “Cost” section, the US remains the most expensive country for health care by double.

My Experience with Health in The United States

In my experience, Americans are not healthy people. I include myself in this as I have personally struggled with various health challenges my entire life.

This said, I feel that the health of society is directly related to the kind of preventive and acute health care we receive. I have never felt confident with the American Healthcare System. Doctors would sooner hand me a prescription and get me out of their office than search for the root cause of my challenges.

My grandmother died from an avoidable medical error at a Los Angeles hospital. My father had his second open heart surgery (for a congenital heart defect) botched by one of the most prestigious heart surgeons in the US, causing him to need a third open-heart surgery soon after.

This past year, an elderly family member went into a comatose state for no apparent reason. Upon investigation it was discovered the doctor had given him 25 conflicting prescription drugs. Once his medication was reduced he returned to normal. Apparently, this is not an unusual occurrence.

A few months ago, a middle-aged relative was given such a high dose of blood pressure medications that she passed out, broke her rib, and had to have emergency surgery.

One of the most terrifying and life-changing experiences I’ve had was living for a month in the same house with a young man (in his early twenties) who was taking a massive quantity of prescription drugs — all given to him legally by his various doctors. His behavior was violent, irrational, abusive, and extremely frightening.

At 17, I was diagnosed with fibromyalgia by the leading fibromyalgia doctor in the US and drugged up with Paxil for anxiety. I often wonder if the fibromyalgia drug Lyrica, which came out a few years later, was named after me. I was also told I had five compacted discs in my back and needed emergency back surgery.

Luckily, I didn’t listen to the doctor’s advice. I managed to get off the Paxil by 18. I currently have no back problems and the fibromyalgia is gone simply because I changed my diet and learned stress-reducing techniques such as meditation and yoga.

I know all these medications have their place, but it has become clear to me that America is definitely a pill-popping culture. In my experience, we are unhappy, unhealthy, and have a low life expectancy as a result of it.


EDUCATION in the United States

classroom in USA
Child asking a question at a school in the USA.
Key findings:

  • United States ranked 12th worst overall, and 6th worst in mathematics.
  • Massachusetts, — the “best” state in America for public education — has a meager 49% of 8th graders scoring proficient or above in reading exams.
  • The state of California was recently sued for providing insufficient education as less than 50 percent of all third, fourth and fifth grade students meet minimum standards for literacy.
  • Wealthy families look to private schools spending upwards of $40,000 per year per high school aged child in big cities.

Click the below toggle to expand more info about education in the US as well as my firsthand experience.

Learn more about EDUCATION in the US – (CLICK to expand)

In Education, the United States ranked 12th worst overall; and performed particularly poorly in mathematics, coming in as the 6th worst country in our study.

The enrollment rate among students in the United States ages 15-19 is 82.9%. Whereas the college-age enrollment rate among students 20-24 is a low 36%.

According to Education Week, New Mexico, where we are currently living, ranks worst in the nation with terrible math and reading scores; while Massachusetts, — the “best” state in America for public education — has a meager 49% of 8th graders scoring proficient or above with reading which is significantly higher than the national average of 35%.

This said the quality of education varies drastically throughout the United States. One reason is that the US public schools are funded primarily by property taxes. If you live in a wealthy suburb, your child’s school is almost guaranteed to be better than a school district in a poor neighborhood. The worst ranking public schools tend to be in low-income areas with high numbers of students of color.

According to the California Political Review, “At one elementary school in California, 96 percent of the students are not proficient in either English or math… A group of prominent lawyers representing teachers and students from poor-performing schools sued California… arguing that the state has done nothing about a high number of schoolchildren who do not know how to read… according to this, less than 32% of all third, and fifth-grade students in the state of California meet minimum standards for literacy.”

Wealthy families often turn to private education but this can cost upwards of $40,000/year per child in big cities.

In my opinion, this should be a human rights issue as it continues to perpetuate the syndrome of racial and income inequality that so deeply affects America. How can these children be expected to rise out of cyclical poverty when they aren’t even given a proper education?

My Experience With Education in America

I don’t have experience with the public school system in America because my parents didn’t feel it was safe to send me to the Los Angeles Unified School District. They were also very concerned with the quality of education the public schools were providing and my physical safety.

Instead, they paid for my private education at Westridge School for Girls in Pasadena which currently costs over $37,000 per year, per child, to attend.

My younger brother attended Oakwood Elementary School at $29,680 per year.

That’s a grand total of $66,680. Which, for almost every American family, is absolutely impossible. According to the 2018 US Census, the average American family has a median income of $61,937.

Because the school systems in New Mexico are inadequate, Asher and I send our 3-year-old child to a private preschool costing $12,500 a year per child. When our 2-year-old daughter is school age approximately $25,000 of our yearly pre-tax income will go towards their education. This is just to keep our children safe and make sure they aren’t in the New Mexico public school system, which is the worst in the nation.


TIME in the United States

Fergusson family in santa barbara
Our family enjoying some quality time in Santa Barbara, California.
Key findings:

  • America ranks by far worst for “Time” getting a solid F.
  • The US is the only country on our list with no government-mandated paid leave of any kind.
  • Only 38% of US organizations offer paid parental leave to all or some new-parent employees. Of the parents that receive paid parental leave, the average length at full pay, is 4.1 weeks (median: 3.0 weeks).

Click the below toggle to expand more info about time in the US as well as my firsthand experience.

Learn more about TIME in the US – (CLICK to expand)
The United States ranks worst on the list in the “time” category. Americans work very long hours per year with zero government-mandated paid maternity, paternity, sick leave, or vacation time.

No other country in our study gives zero paid maternity leave, or zero paid vacation time.

Our Experience with “Time” and Raising a Family

After giving birth to our first child, my husband Asher was able to take off one day of unpaid time to be with me.

We had decided I would be a stay at home mom. Because of this, he was working two jobs, and some nights until 9pm at night just to make ends meet for us. He also had no built-in paid vacation time or sick days he could use. He was being paid hourly, and we really needed the money.

Luckily my son was born on a Thursday so we had the weekend together. After that, I was on my own, still physically recovering from birth and with a newborn.

Asher and I felt extremely unsupported. Birthing costs are expensive in the US and so we were already strained just from those costs. Overall, we were stressed because of the lack of any time of structured governmental support.


What does all this mean for American families?

As a nation, we need to start honestly asking ourselves, “What is my experience of America?”

So many Americans fail to look outside of the US for reference. And so, we are left with ingrained idealism that doesn’t line up with our actual experience.

The US has a remarkable way of burying its failings. It wields wealth and military power with almost Hollywood glossiness to cover up the deep corrosive behavior that is eating away at our culture.

Key events in America’s history are not properly taught in schools or terribly whitewashed, (see “Happiness” section.) How can we expect to raise compassionate, caring generations aware of such things as systemic racism if we are never taught it exists?

We are failing our children when Massachusetts — the “best” state in America for public education — boasts it has a meager 49% of 8th graders scoring proficient or above with reading. Or that school shootings have become so commonplace that 95% of students in the public school systems are being exposed to Active Shooter Drills. (See “Safety” section)

It’s easy for many to blame the current political climate for its glaring inadequacies; the problems we’ve highlighted in this study have been seething beneath the surface for decades — Democrats or Republicans at the helm.

I have lived in 10 different US states and moved over twenty times in my life. The problems vary to some degree state by state, but the undercurrent stays the same.

Growing up I heard it from my parents, I learned it in school: “America is the land of the free, and the home of the brave. America is the most progressive country in the world. Land of opportunity. Wealthiest. With the best doctors, the best quality of life, the best universities…”

The list goes on. But is any of it true?

As mentioned in the “Health” section, American mothers are twice as likely to die in childbirth here as in Canada — even though it will cost us three times as much for a standard hospital birth.

America certainly has the opportunity, but it is usually for the wealthy who can afford to take advantage of it. Parents raising their children here are slapped in the face with that fact daily.

I have come to the heartbreaking conclusion that America is a deeply challenged and troubled country. It doesn’t, and maybe never did line up with its own ideology.

I think if we, as Americans, are truly honest with ourselves, we might understand why the United States ranks solidly as the second-worst country to raise a family.

My aspiration is that something will substantially change in my children’s lifetime. There are many things I love about this country, I hope we can all rise to the occasion.

Highest ranking countries in each category

  1. SAFETY: Iceland
  2. iceland flagIt’s no coincidence that Iceland is the safest country as well as the third happiest country on our list. Happy people are far less likely to perform criminal acts and are far more likely to live peacefully as a society.

    Iceland performed well in all five safety categories, including one of the lowest homicide rates, with only 37 murders in the past 20 years. Compare that to the US which experienced over 14,123 homicides in 2018 alone (that’s over 38 per day!) and 288 school shootings in the past ten years (from 2009-2018).

    Iceland is also a world leader in human rights, scoring second best on this list, emphasizing equal rights for “all persons, of whatever nation, regardless of their residence, gender, nationality, race, religion, language or other status.” No matter the origins of a child or who they turn out to be, Iceland’s constitution ensures they will be treated unequivocally as an equal.


  3. HAPPINESS: Denmark
  4. denmark flagAlmost every “Happiest Countries in the World” list you’ll come across will be jam-packed with Scandinavian countries towards the top. A big reason for this happiness, in countries such as Denmark, can be attributed to supporting the basic needs of its people, naturally keeping stress levels low and ease of life high. Studies have shown that, in general, people are happier in countries with comparatively generous welfare benefits, and where the labor market is regulated in such a way to avoid employee exploitation.

    In the US, this notion of caring for citizens by offering such base level benefits as universal health care and free or affordable quality education, all the way through university, is often demonized. Countries like Denmark have proven again and again that the high level of security and better quality of life that these social benefits offer, leads to a happier population.


  5. COST: Sweden
  6. sweden flagSweden has a well-earned reputation for taking great care of its citizens, especially when it comes to benefits associated with raising a child, including education, healthcare and childcare. Only 4.1% of the average household income in Sweden needs to go towards childcare costs. Compare that to the US, New Zealand, UK, and Australia, where parents need to spend over 30% of the average household income.


  7. HEALTH: Finland
  8. finland flagFinland has a top-notch healthcare system that’s actually affordable. Giving birth in Finland is often less than $100 and not more than a few hundred. Compare that to the USA, where giving birth costs more than $10,000 on average. Additionally, Finland also has the lowest infant mortality rate in the world, so it’s also the safest place in the world to give birth.

    With a low average PM2.5 measurement of 5.63 micrograms/cubic meter and 0% of the population being exposed to air pollution above W.H.O. limits, Finland has some of the cleanest air on earth which can go a long way in maintaining life-long health.


  9. EDUCATION: Slovenia
  10. slovenia flagSlovenia scored well across the board in the education category, performing well both in enrollment rates and test scores. Impressively, Slovenia has the highest enrollment rates of any country for students both in the 15 to 19 and 20 to 24 age range, with enrollment rates of 93.4% and 59.8% respectively.


  11. TIME: Luxembourg
  12. luxembourg flagLuxembourg offers generous paid time off in all categories, none more important than the crucial time period surrounding the birth of a child. In Luxembourg, the mother gets 31.6 weeks, and the father an exceptionally high 13.6 weeks paid parental leave. Being able to spend this time with your newborn child is such a blessing to both parent and child, allowing families to build a foundation, a family bond that’s difficult to achieve if both parents have to rush back to work.

    Chronic stress is a huge issue in the workplace, leading to burnout and eventually illness. Having a work/life balance is essential for mental health and overall happiness, both for individuals and families as a whole. Countries like Luxembourg that realize this, set mandates for generous paid time off requirements that lead to happier, healthier, and more productive citizens.

Lowest ranking countries in each category

  1. SAFETY: Mexico
  2. mexico flagAlthough many parts of Mexico are relatively safe, especially tourist destinations, there is also widespread violence and corruption that affects many of its citizens. Mexico’s homicide rate has increased every year since 2014 and recent statistics show that there are 34.1 homicides per 100,000 people, by far the most on this list.

    According to Gallup’s Law and Order Index, Mexico received by far the lowest score on this list (at 60), indicating that its citizens, in general, have a very low personal sense of security.


  3. HAPPINESS: South Korea
  4. South Korea is a modern country with a relatively strong economy (11th largest in the world), but that combination is not necessarily a recipe for a happy populous. South Korean’s work some of the longest hours in the world (nearly 2000 hrs per year on average), while putting much less emphasis on socializing and leisure than the top countries on this list. In other words, they are missing that work/life balance that’s so important to the average person.

    According to a Korea Development Institute (KDI) survey, 20.2 percent of respondents said they “felt unhappy in the past, as well as in the present, and don’t expect to feel better in the future.” Also, the KDI stated that participants “showed significant anxiety towards the social system and social mobility in South Korea.” 7 in 10 said they “were worried about falling down the social ladder.”

    This stressful lifestyle and the often unattainable societal expectations, have contributed to an unusually high suicide rate of 23 suicides per 100,000 people per year, significantly more than any other country on this list.


  5. COST: United States
  6. united states flagIn the overall Cost Index, the US placed dead last, performing twice as poorly as New Zealand which finished just ahead of the US. Parents with average household income have to spend 31.79% of their income on childcare costs alone. Compare that to Scandinavian countries, where households only have to spend 4% to 10% of household income to raise a well-rounded child.

    The top countries on this list spend over 3% of GDP on family benefits such as affordable childcare, while the US spends a meager 0.64%. Shortages of childcare providers is a big issue in America, additionally, when available, they are often too expensive for the average family. According to the Center for American Progress, half the U.S. population lives in areas lacking enough daycare providers. Having a top-notch childcare system is a key component in allowing both parents to enter the job market which is a win-win both for families and the economy as a whole.


  7. HEALTH: Mexico
  8. mexico flagWhen it comes to health, Mexico does some things well but raises red flags in key areas that have earned it the worst position in this category.

    While Mexico has some first-rate hospitals, at affordable prices that attract foreigners (especially from the US), the range of quality can vary drastically, especially outside of larger cities. This inconsistency in quality can be seen in both the high maternal mortality rate and the under-five child mortality rate. Mexico experiences 38 maternal deaths per one hundred thousand live births and 12.73 under-five deaths per one thousand children, both higher than any other country on this list and far higher than the top countries.

    Air quality is also an issue in Mexico with 99.9% of the population exposed to air pollution above W.H.O. limits. The average PM2.5 measurement of 20.02 micrograms/cubic meter is well above ideal limits and could impact long-term health.


  9. EDUCATION: Mexico
  10. mexico flagThe progression of students through the Mexican education system is not optimal, particularly when compared to the top countries on this list. While 90% of children attend primary school only, 61% are still enrolled during the ages of 15 to 19. Only 25.9% continue on to higher education after their teenage years.

    This lack of sustained enrollment has been reflected in the poor test scores associated with the International Student Assessment. Out of all the countries on this list, Mexico performed worst in all three categories: reading, mathematics, and science.


  11. TIME: United States
  12. united states flagThe US is the only country on this list that does not require employers to offer even a single day of paid maternity leave, paid paternity leave or paid vacation. Every other country offers comparatively generous paid maternity leave and paid vacation.

    Many US employers do offer minimal paid leave, but usually far less than that of other countries. A typical full-time employee in the US will receive 10 days paid vacation per year, while most other countries get approximately 30 days a year.

How COVID-19 will play into determining the best country to raise a family

Although the future of COVID-19 is uncertain, some believe it’s a health issue that we could face for months, years, or possibly even as a seasonal illness. This virus has had a huge impact on the world and may be a factor to consider going forward when it comes time to decide the best place to raise a family. Which countries offered their citizens the best benefits during a health and financial crisis such as this? Factors such as healthcare costs, public spending on family benefits, and safety will become much more important to factor into the decision-making process. Going forward, families may need to look at how different countries handled the COVID-19 pandemic to determine the best place to raise their family.


Sources

Safety

Happiness

Cost

Health

Education

Time